

With September here and Fall approaching, most of Wake Counties’ residents are enjoying the cool temperatures as a break from the intense heat of July and August. It was a very hot summer, both in temperature and in price appreciation!
Let’s take a look at a Wake County housing market stats report published by the Triangle MLS.
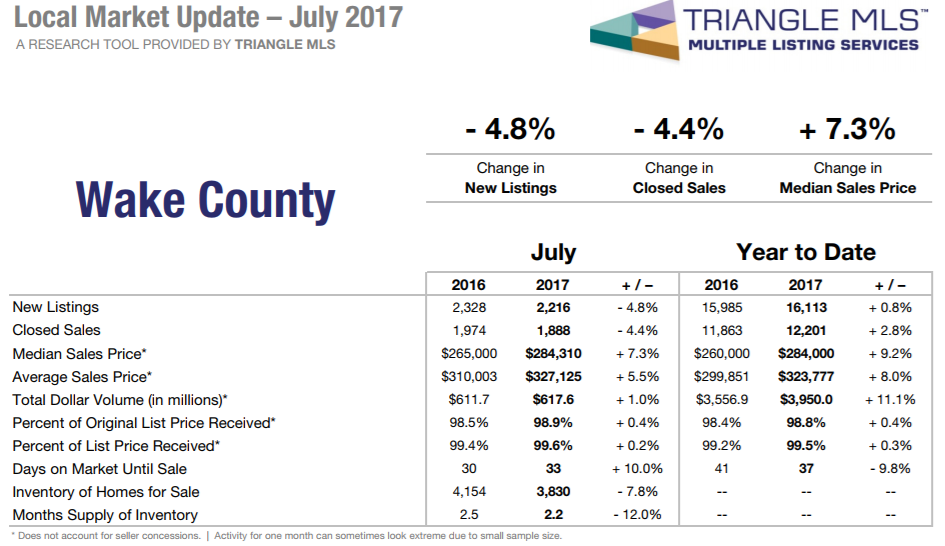
Wake County Housing Market Stats – Summer 2017
Median Sales Price Data
Median sales price refers to the number in the middle, so with regard to the sales price, this means half of the homes sold are above this price, and the other half are below. The median sales price of homes in Wake County has increased +9.2% to $284,000 for this year. This is a great number for homeowners and landlords alike, as we are seeing a strong appreciation for our real estate!
For buyers, this means that homes are rapidly becoming more expensive, so hesitating to pull the trigger on a home purchase can be costly.
Average Sales Price Data
The average sales price is calculated by adding up the sold prices together and then dividing it by the number of units sold. We have experienced an +8.0% increase in average sales price with the average price has increased to $323,777, from $299,851 in 2016.

Percent of list price received
You’ll notice the 2 numbers above. Percent of list price received, and percent of original list price received. These numbers take into account if the seller adjusted their list price (usually downward) to adapt to changes in the marketplace.
The number I immediately notice is the percentile of 98% and 99% respectively. This means that the list price is far less negotiable in the current market. This chart does not take seller concessions into play (seller paid closing costs etc.), but it’s interesting to note that sellers are not coming down far on their asking price. As you’ll often hear, multiple offer situations, are more and more common in this market.
Days on Market
This means the amount of time it takes for the seller to accept an offer from a buyer and go “under contract”. The average number of days for July 2017 was 33, which is an increase of 3 days from July 2016. You can see the year-to-date number at 37 days on the right-hand side.
The important thing to remember here is that if you are planning to sell a house, it will take 30 – 40 days, on average, to find a buyer and then go under contract. The buyer must then close the transaction by obtaining financing.
The process of obtaining financing can take an additional 45 – 60 days. This is an important figure to keep in mind during the planning period, as it can take 3 months, or more, to get a check.
Inventory of homes for sale
As you can see the number of available homes for sale has dropped from 4,154 last year, to 3,830 this year. There is still not enough supply to keep up with the demand for new homes. This has lead to a very competitive market that favors the sellers.

Average Price Per Square Foot
This data is not contained in the above table, but it is something I like to keep track of. According to a market report published by Zillow, the median list price-per-square-foot in Wake County is $139. This is slightly higher than $134 per square foot as reported by Realtor.com
I like to keep up with the average price-per-square-foot as a general benchmark for estimating the affordability of different-sized homes. Since I buy property regularly, I need a way to quickly estimate how a property is priced relative to others in the area.
This number is also useful for first-time home buyers. For example, if you have been pre-approved for a loan amount of $200,000, you can divide that number by the avg. price per square foot:
200,000/135 = 1481
Therefore if you definitely want to live inside Wake County, and have $200,000 to spend, you’ll be looking for homes approximately 1500 square feet in size.